- 13 min read

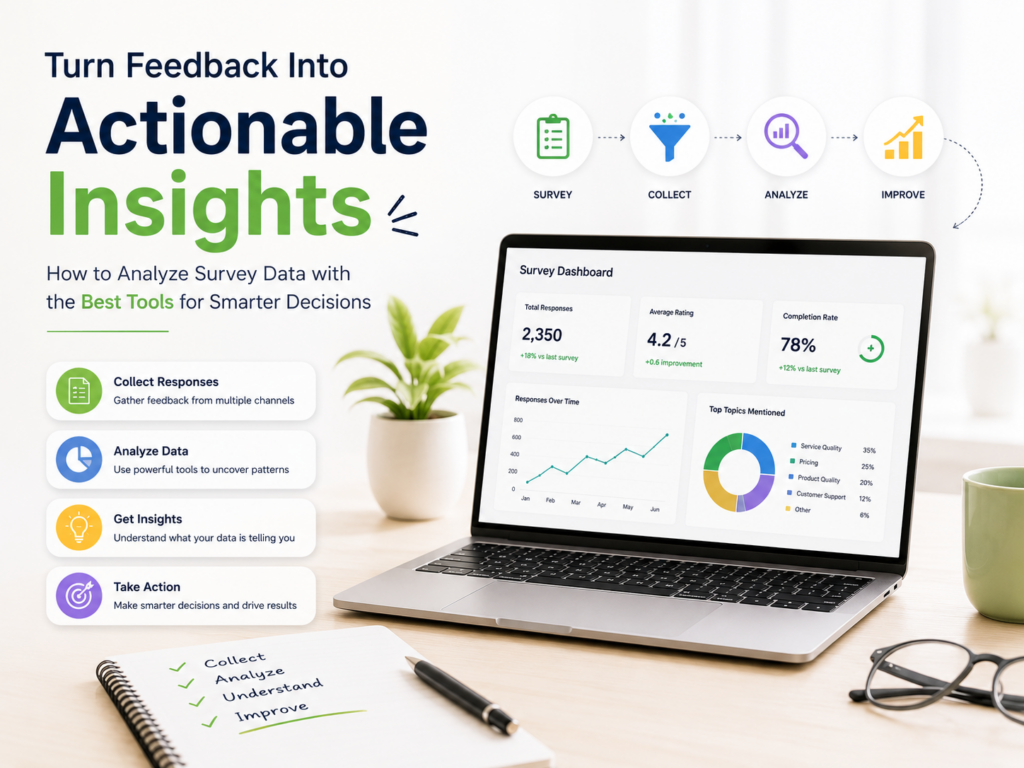
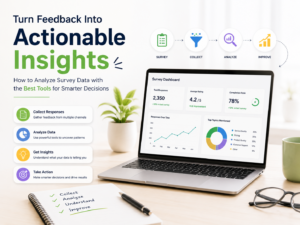
Collecting survey responses is only the beginning.
The real value lies in understanding what those responses reveal about your customers, employees, patients, or users. Unfortunately, many organizations spend weeks gathering feedback only to leave it sitting in spreadsheets without uncovering meaningful insights.
That’s where survey analysis software becomes essential.
Modern businesses receive feedback from websites, emails, QR code surveys, mobile apps, customer support conversations, social media, product reviews, and online forms. Without the right tools, analyzing thousands of responses becomes slow, frustrating, and error-prone.
Learning how to analyze survey data effectively allows organizations to identify patterns, improve customer experiences, make informed business decisions, and measure success with confidence.
Whether you’re running a startup, restaurant, SaaS company, healthcare organization, educational institution, or enterprise business, investing in the best survey analysis software can transform raw feedback into actionable intelligence.
In this guide, you’ll learn:
- What survey analysis software does
- Why survey analysis matters
- How to analyze survey data step by step
- Features every survey analysis platform should include
- The role of AI in survey analytics
- Common mistakes businesses make
- How SurveyFlip simplifies survey analysis
What Is Survey Analysis Software?
Survey analysis software is designed to organize, interpret, visualize, and report survey responses automatically.
Instead of manually reviewing hundreds—or even thousands—of responses, the software processes the information and presents it in an easy-to-understand format through charts, dashboards, reports, and AI-powered summaries.
A good survey analysis platform helps businesses answer questions like:
- What percentage of customers are satisfied?
- Which product feature receives the most complaints?
- Why are employees leaving?
- Which marketing campaign performs best?
- What improvements should we prioritize?
Rather than overwhelming users with raw data, the software turns responses into meaningful insights that support faster decision-making.
Why Survey Analysis Is More Important Than Ever
Businesses today collect more customer feedback than ever before.
Surveys come from:
- Customer satisfaction surveys
- Net Promoter Score (NPS) surveys
- Employee engagement surveys
- Market research questionnaires
- Event feedback forms
- Healthcare patient surveys
- Product feedback forms
- Educational evaluations
However, collecting feedback without analyzing it creates no business value.
Survey analysis helps organizations:
- Understand customer expectations
- Identify recurring problems
- Improve products and services
- Increase customer retention
- Measure employee satisfaction
- Reduce churn
- Prioritize future improvements
Without proper analysis, important trends often remain hidden inside thousands of survey responses.
Why Traditional Spreadsheet Analysis No Longer Works
Many organizations still export survey results into spreadsheets for manual analysis.
While spreadsheets remain useful for small datasets, they quickly become inefficient when survey volume grows.
Manual analysis often requires teams to:
- Remove duplicate responses
- Filter incomplete surveys
- Build charts manually
- Calculate averages
- Review every open-ended response
- Create reports
- Present findings
This process can take days—or even weeks.
By the time reports are ready, the opportunity to act may already be gone.
Modern survey analysis software automates these tasks in minutes.
How to Analyze Survey Data
Understanding how to analyze survey data involves more than calculating averages.
Effective survey analysis follows a structured process.
Step 1: Define Your Research Goal
Every survey should answer a business question.
Examples include:
- Why are customers cancelling subscriptions?
- Which restaurant location delivers the best service?
- What product feature should we build next?
- Are employees satisfied with workplace communication?
Without a clear objective, analysis quickly becomes overwhelming.
Step 2: Clean Your Survey Data
Before analyzing responses, remove:
- Duplicate submissions
- Spam responses
- Test entries
- Incomplete surveys
- Invalid responses
Clean data leads to more accurate insights.
Step 3: Organize Responses
Group similar information together.
Examples:
Customer demographics
- Age
- Gender
- Location
- Industry
Behavioral information
- Purchase frequency
- Product usage
- Customer type
Segmentation often reveals insights that averages cannot.
Step 4: Analyze Quantitative Responses
Quantitative responses include:
- Rating scales
- Multiple choice questions
- Likert scales
- Rankings
- NPS scores
Software automatically calculates:
- Mean
- Median
- Mode
- Distribution
- Percentages
- Trend lines
These metrics help identify overall satisfaction levels.
Step 5: Analyze Qualitative Responses
Open-ended questions often contain the most valuable insights.
Examples:
- “What could we improve?”
- “What did you enjoy most?”
- “What almost stopped you from purchasing?”
Instead of reading thousands of comments manually, modern qualitative survey data analysis tools automatically categorize responses into themes.
Step 6: Visualize Results
Charts make survey results easier to understand.
Common visualizations include:
Bar Charts
Best for:
- Rating comparisons
- Satisfaction scores
- Multiple-choice responses
Pie Charts
Useful for:
- Demographic breakdowns
- Preference comparisons
Line Charts
Perfect for:
- Tracking satisfaction over time
- Monitoring trends
Heatmaps
Excellent for identifying:
- High-performing categories
- Problem areas
Word Clouds
Highlight commonly used words within text responses.
Step 7: Identify Patterns
Instead of focusing on individual responses, look for recurring themes.
Examples:
- Customers repeatedly mention slow shipping.
- Employees consistently request flexible work schedules.
- Restaurant guests praise friendly staff but complain about wait times.
Patterns deserve attention.
Individual comments may simply be isolated opinions.
Step 8: Turn Insights Into Action
Survey analysis should always end with decisions.
Ask:
- What should we improve?
- What should remain unchanged?
- What deserves further investigation?
Data becomes valuable only when it influences action.
Types of Survey Data
Most surveys include both quantitative and qualitative information.
Quantitative Data
Numerical responses such as:
- Satisfaction ratings
- Yes/No answers
- Rankings
- Star ratings
- NPS
These responses are easy to summarize statistically.
Qualitative Data
Text-based answers including:
- Suggestions
- Complaints
- Testimonials
- Ideas
- Experiences
Qualitative responses explain why customers selected particular ratings.
Understanding Qualitative Survey Data Analysis Tools
Many businesses underestimate the importance of analyzing written responses.
Unfortunately, manually reading thousands of comments is unrealistic.
Modern qualitative survey data analysis tools solve this problem by automatically:
- Detecting recurring themes
- Grouping similar comments
- Measuring sentiment
- Highlighting common keywords
- Summarizing large datasets
Instead of reading 5,000 customer comments individually, AI can summarize the most important issues within minutes.
Features Every Survey Analysis Tool Should Include
Real-Time Dashboards
Businesses shouldn’t wait until surveys close before viewing results.
Real-time dashboards allow teams to:
- Monitor incoming responses
- Spot trends immediately
- Detect problems early
AI-Powered Text Analysis
Artificial intelligence now helps businesses understand open-ended feedback automatically.
Look for features such as:
- Sentiment analysis
- Theme detection
- Keyword extraction
- Automatic summaries
Cross-Tabulation
Cross-tabs compare responses across multiple groups.
Examples:
Customer satisfaction by:
- Age
- Gender
- Country
- Product type
These comparisons uncover valuable insights.
Advanced Filtering
Filter responses using:
- Date ranges
- Customer segments
- Product categories
- Departments
- Locations
Filtering helps answer highly specific business questions.
Interactive Reports
Reports should be:
- Easy to understand
- Shareable
- Customizable
- Presentation-ready
Export Options
Good platforms allow exporting to:
- Excel
- CSV
Some also integrate with:
- Google Sheets
- Power BI
- Tableau
- CRM systems
Team Collaboration
Modern analytics platforms support multiple users.
Teams can:
- Share dashboards
- Add comments
- Create reports together
Mobile Analytics
Decision-makers increasingly monitor dashboards from smartphones.
Mobile accessibility has become essential.
Benefits of Using Survey Analysis Software
Organizations that use dedicated survey analytics software enjoy several advantages.
Faster Decision-Making
Insights appear immediately instead of weeks later.
Reduced Manual Work
Automation replaces repetitive spreadsheet tasks.
Better Accuracy
Software eliminates calculation errors.
Improved Customer Experience
Businesses respond faster to customer concerns.
Better Executive Reporting
Professional dashboards improve stakeholder communication.
Higher ROI
Organizations gain more value from every survey conducted.
Common Survey Analysis Mistakes
Looking Only at Overall Scores
An average rating may hide important differences between customer groups.
Always segment responses.
Ignoring Written Feedback
Open-ended comments explain why customers selected specific ratings.
Never ignore them.
Waiting Too Long
Survey data loses value over time.
Analyze responses continuously.
Collecting Too Much Data
Long surveys create unnecessary analysis.
Only ask questions you intend to use.
Focusing on One Negative Comment
Individual complaints matter less than recurring patterns.
Survey Analysis Across Different Industries
Marketing
Marketing teams analyze:
- Brand awareness
- Campaign effectiveness
- Customer preferences
SaaS
Product teams monitor:
- Feature requests
- User experience
- Customer satisfaction
Healthcare
Healthcare organizations review:
- Patient satisfaction
- Appointment experiences
- Communication quality
Restaurants
Restaurants evaluate:
- Food quality
- Staff friendliness
- Wait times
- Overall dining experience
Education
Schools analyze:
- Student engagement
- Course evaluations
- Instructor performance
Manual Analysis vs Survey Analysis Software
| Manual Analysis | Survey Analysis Software |
| Time-consuming | Automated |
| Spreadsheet dependent | Interactive dashboards |
| Difficult to scale | Handles thousands of responses |
| High risk of errors | Accurate calculations |
| Manual chart creation | Automatic visualization |
| Manual text review | AI-powered text analysis |
How AI Is Changing Survey Analysis
Artificial intelligence has dramatically improved survey analytics.
Modern AI helps businesses:
- Detect customer sentiment
- Summarize thousands of comments
- Identify recurring complaints
- Recommend priorities
- Predict emerging trends
Instead of spending hours reviewing responses, organizations receive actionable insights within minutes.
How SurveyFlip Simplifies Survey Analysis
SurveyFlip combines powerful survey creation with advanced analytics.
Users can:
- Track responses in real time
- Build interactive dashboards
- Analyze quantitative and qualitative data
- Monitor response trends
- Export professional reports
- Share results with teams
- Identify customer insights automatically
Instead of managing spreadsheets, SurveyFlip helps businesses focus on making better decisions.
Choosing the Best Survey Analysis Software
When evaluating different platforms, ask:
- Is it easy to use?
- Does it support real-time dashboards?
- Can it analyze open-ended responses?
- Does it include AI-powered insights?
- Can teams collaborate?
- Does it integrate with existing tools?
- Is reporting customizable?
- Can it scale with business growth?
The best survey analysis software saves time while delivering meaningful insights.
Final Thoughts
Learning how to analyze survey data is no longer optional.
Organizations collect more feedback than ever before, but only those that analyze it effectively gain a competitive advantage.
Modern survey analysis tools transform raw responses into clear, actionable insights that improve products, customer experiences, employee satisfaction, and business performance.
Whether you’re looking for data analysis software, evaluating the best survey analysis software, or searching for advanced qualitative survey data analysis tools, the goal remains the same:
Turn feedback into better decisions.
The businesses that analyze faster learn faster.
And the businesses that learn faster grow faster.
Frequently Asked Questions (FAQ)
1. What is survey analysis?
Survey analysis is the process of organizing, interpreting, and summarizing survey responses to identify meaningful patterns, trends, and insights. It helps businesses make informed decisions based on customer, employee, or market feedback.
2. How do you analyze survey data effectively?
To analyze survey data effectively:
- Define your research objective.
- Clean and organize the data.
- Separate quantitative and qualitative responses.
- Visualize results with charts and dashboards.
- Identify trends and recurring themes.
- Turn insights into actionable business decisions.
3. What are survey analysis tools?
Survey analysis tools are software platforms that automatically process survey responses, generate reports, create charts, analyze text responses, and help businesses understand feedback without relying on manual spreadsheets.
4. What is the best survey analysis software?
The best survey analysis software depends on your needs, but look for platforms that offer:
- Real-time dashboards
- AI-powered text analysis
- Interactive reports
- Data visualization
- Filtering and segmentation
- Export options
- Team collaboration
- Mobile-friendly analytics
5. Why is survey analysis important?
Survey analysis helps organizations:
- Improve customer satisfaction
- Understand employee engagement
- Identify product improvements
- Measure campaign performance
- Reduce customer churn
- Make data-driven decisions
Without analysis, survey responses provide very little business value.
6. What is the difference between quantitative and qualitative survey data?
Quantitative survey data includes numerical responses such as ratings, rankings, and multiple-choice answers.
Qualitative survey data includes written comments, suggestions, opinions, and detailed feedback that explain why respondents answered the way they did.
7. What are qualitative survey data analysis tools?
Qualitative survey data analysis tools help businesses organize and interpret open-ended responses. Many platforms use AI to identify recurring themes, analyze sentiment, summarize comments, and highlight common customer concerns automatically.
8. Can AI analyze survey responses?
Yes. Modern survey analysis platforms use artificial intelligence to:
- Detect customer sentiment
- Summarize written feedback
- Identify common themes
- Extract keywords
- Highlight emerging trends
AI dramatically reduces the time required to analyze large amounts of survey data.
9. What metrics should I track when analyzing survey data?
Common survey metrics include:
- Response rate
- Completion rate
- Customer Satisfaction Score (CSAT)
- Net Promoter Score (NPS)
- Average rating
- Survey completion time
- Response distribution
- Sentiment trends
Tracking these metrics helps measure survey performance and customer satisfaction.
10. How can businesses analyze open-ended survey responses?
Businesses can analyze open-ended responses by:
- Grouping similar comments
- Categorizing responses into themes
- Performing sentiment analysis
- Using keyword extraction
- Leveraging AI-powered qualitative analysis tools
This approach makes large volumes of written feedback easier to understand.
11. What industries benefit most from survey analysis software?
Survey analysis software is valuable for:
- SaaS companies
- Healthcare organizations
- Retail businesses
- Restaurants
- Hotels
- Educational institutions
- Marketing agencies
- HR departments
- Financial services
- Government organizations
Any organization collecting feedback can benefit from survey analytics.
12. What features should survey analysis software include?
Essential features include:
- Real-time analytics
- Interactive dashboards
- AI-powered text analysis
- Data visualization
- Cross-tab reporting
- Advanced filtering
- Export to Excel or PDF
- Team collaboration
- Mobile access
- Secure data storage
13. Can survey analysis software integrate with other business tools?
Yes. Many survey platforms integrate with CRM systems, marketing automation platforms, business intelligence software, Google Sheets, Slack, Microsoft Teams, and project management tools to streamline workflows.
14. What are common mistakes when analyzing survey data?
Common mistakes include:
- Ignoring open-ended responses
- Looking only at averages
- Not segmenting respondents
- Analyzing incomplete data
- Waiting too long to review results
- Collecting more data than necessary
- Failing to act on survey insights
Avoiding these mistakes leads to more reliable conclusions.
15. How often should survey data be analyzed?
For ongoing customer or employee feedback, survey data should be monitored continuously using real-time dashboards. For periodic surveys, it’s best to analyze results immediately after the survey closes so insights remain relevant.
16. Is Excel enough for survey analysis?
Excel works well for small surveys with limited responses. However, as response volume increases, dedicated survey analysis software offers faster processing, automated reporting, AI-powered insights, and better visualization than spreadsheets alone.
17. How does SurveyFlip help analyze survey data?
SurveyFlip simplifies survey analysis by providing:
- Real-time response tracking
- Interactive dashboards
- AI-assisted insight generation
- Quantitative and qualitative analysis
- Easy report exports
- Team collaboration
- Visual charts and graphs
It helps businesses spend less time analyzing data and more time acting on meaningful insights.
18. What is the biggest benefit of using survey analysis software?
The biggest benefit is speed. Instead of manually reviewing spreadsheets and comments, survey analysis software automatically transforms responses into clear, actionable insights, enabling faster decisions and better business outcomes.